The Pie Chart Method: Helping Clients Recalibrate Health-Related Probability Estimate
Oct 09, 2025
Clients with health anxiety often assume that many symptoms signal serious illness. This occurs because they tend to overestimate the likelihood of a severe or life-threatening condition. Even clients with an existing medical diagnosis frequently assume that a new symptom means their health condition is worsening or returning. Inflating the perceived odds of catastrophe keeps them trapped in a state of chronic threat. When clients assume that every symptom represents a medical crisis, they spend much of their daily life in fight-or-flight mode.
Introducing the Pie Chart Method
The Pie Chart Method helps clients visually recalibrate their perception of health risk. For example, suppose a client experiences stomach pain. Despite their physician’s reassurance that it is likely due to a virus, indigestion, or another benign cause, the client worries that it could be something far more serious, such as cancer. The Pie Chart Method can be used to create a visual representation of the relative likelihood that a given symptom reflects a serious or catastrophic illness versus a benign explanation.
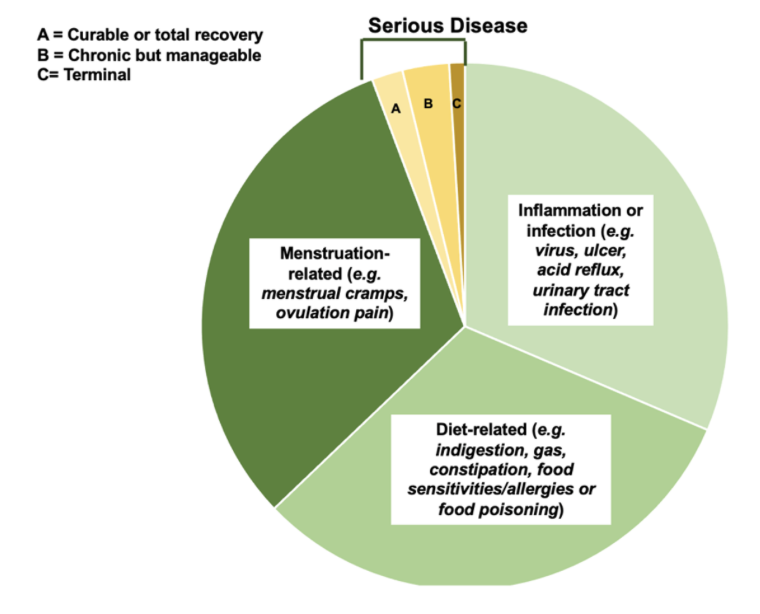
When guiding clients through this exercise, you can begin by helping them divide the chart into several categories (see chart above for example). The serious illness portion of the chart can include three subcategories: illnesses that are curable or fully recoverable, illnesses that are chronic but manageable, and terminal illnesses. Clinicians should encourage clients to assign small percentages to these serious illness categories, as statistically, they are much less common than benign or self-limiting conditions. If the client has a diagnosed medical condition and fears that a symptom indicates a worsening of their illness, that concern can be represented within the relevant portion of the “serious illness” section.
For the remainder of the chart, help clients brainstorm several potential non-catastrophic explanations for the symptom. In the case of a stomachache, examples might include inflammation or minor infection (e.g., virus, ulcer, reflux, urinary tract infection), diet-related causes (e.g., indigestion, gas, constipation, food sensitivities, food poisoning), or, for female clients, menstruation-related discomfort (e.g., cramps, ovulation pain).
Once complete, this visual often highlights that only one of the three serious illness categories involves a truly catastrophic outcome, which is the terminal illness subcategory. The other two serious categories, those involving full recovery or manageable chronic conditions, are not inherently catastrophic because they allow for continued functioning, treatment, and recovery.
Shifting Cognitive Biases
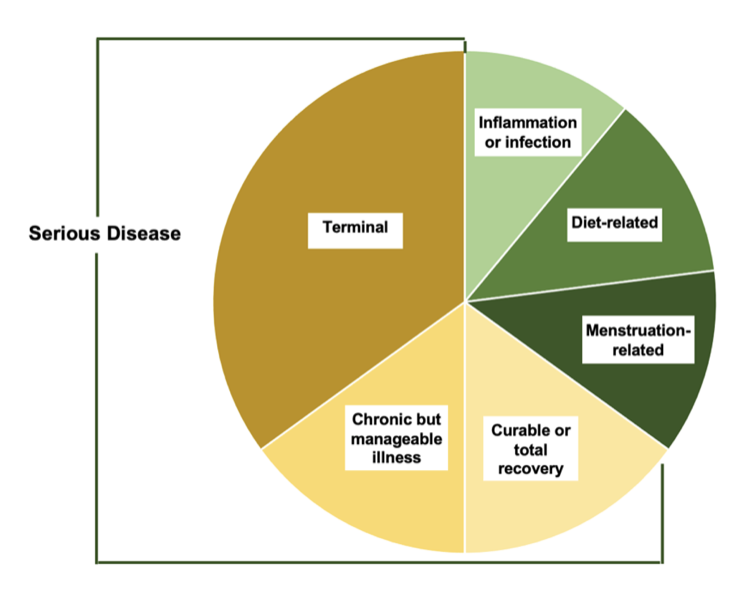
The goal of the exercise is to help clients recognize how easily they overestimate the probability of catastrophe. While the realistic pie chart shows a small sliver representing serious or terminal illness, the mental “pie chart” that clients carry around often looks quite different. In their minds, catastrophic outcomes occupy most of the space (see example below). And, as you can imagine, anyone who genuinely believed the odds of a terminal illness were that high would understandably feel anxious about every bodily sensation.
The Clinical Utility of the Pie Chart Method
The Pie Chart Method offers several therapeutic benefits. First, it helps clients develop a habit of broadening their attention beyond catastrophic possibilities and considering a full range of benign explanations for bodily sensations. Second, it provides a structured way to estimate probability more realistically. By seeing that the likelihood of catastrophe occupies only a small portion of the chart, clients can begin to challenge distorted thinking patterns and reduce anxiety-driven safety behaviors.
Clinical Implementation
Encourage clients to try this exercise the next time they become anxious about a symptom. Offer the following practical steps to structure the exercise:
-
Start with the serious illness category. Have clients make small slivers representing serious illness subcategories, as in the example chart. Remind them not to list out every possible serious disease, as doing so can be counterproductive and fuel further anxiety. The goal is to represent categories of possibility, not to expand the list of feared outcomes.
-
Move to the non-catastrophic causes. This portion will take longer, as these outcomes are both more numerous and statistically more likely. Encourage clients to brainstorm as many minor or benign explanations as possible.
If clients struggle to identify benign causes, they can consult a trusted medical professional who can offer quick, balanced input about common non-serious explanations. Alternatively, clients can search online for benign causes of the symptom from reputable sources. However, if internet reassurance-seeking is one of the client’s safety behaviors, you may suggest delegating this step to a loved one or completing it collaboratively in session to maintain therapeutic structure.
Summary
The Pie Chart Method offers a simple yet powerful way to help clients visually confront their cognitive bias toward overestimating medical catastrophe. By quantifying probabilities and broadening their perception of possible explanations, clients can learn to approach bodily sensations with greater perspective, less fear, and improved cognitive flexibility. Over time, this shift not only reduces distress in the moment but also weakens the broader cognitive patterns that maintain health anxiety.
Want to take the next step to help clients with health anxiety?
If you are a mental health professional and want to better understand health anxiety and how to treat it, take my comprehensive course- Treating Health Anxiety with Exposure-Based Cognitive Behavioral Therapy. If you are a licensed clinical social worker, this course is approved by ASWB for 13 clinical continuing education credits.
